Toronto’s Living Edge: Mapping the Waterfront’s Green Gradient
- Zarrin Tasneem
- Nov 5, 2025
- 2 min read

Stretching from Mississauga to Pickering, Toronto’s waterfront is more than a line on the map, it is a living gradient of vegetation, architecture, and atmosphere. This stretch along Lake Ontario captures how a modern city meets its natural edge, revealing the delicate balance between urban density and ecological space.
Using Sentinel-2 multispectral imagery, I mapped vegetation patterns along the waterfront at a spatial resolution of ~20 m. The resulting NDVI (Normalized Difference Vegetation Index) gradient highlights how green intensity fluctuates across parks, neighborhoods, and industrial zones. From the lush canopy of High Park and Humber Bay to the fragmented greens of the Port Lands and Tommy Thompson Park, each patch of vegetation tells a story of restoration, recreation, and resilience.
Key Observations
Western Waterfront (Humber Bay to High Park): High NDVI values reflect dense tree cover and continuous green corridors.
Downtown Core (Harbourfront to Port Lands): Noticeable dip in vegetation, replaced by built-up surfaces; however, emerging green roofs and waterfront redevelopment projects show recovery trends.
Eastern Waterfront (Leslie Street Spit to Scarborough Bluffs): A striking rise in NDVI, capturing the city’s transition back into forested escarpments.
Why It Matters
The Toronto Waterfront Gradient is a visual reminder that cities breathe through their green veins. By mapping vegetation dynamics with open satellite data, we can quantify not only beauty but also the ecological services that urban greenery provides such as cooling, air purification, and mental restoration.
Data and Methods
Satellite: Sentinel-2 MSI (2024 summer composite)
Index: NDVI = (NIR − Red) / (NIR + Red)
Processing: Google Earth Engine
Scale: ≈ 20 m
Visualization: NDVI rendered from 0 to 1 with a reliable percentile stretch for clarity
Next Steps
Future layers will explore surface temperature (LST) and urban heat island intensity, revealing how vegetation correlates with microclimate along this waterfront gradient. Together, they will form part of a broader Urban Climate Atlas of the Greater Toronto Area.

Figure 1: Waterfront Gradient in Toronto on a Basemap
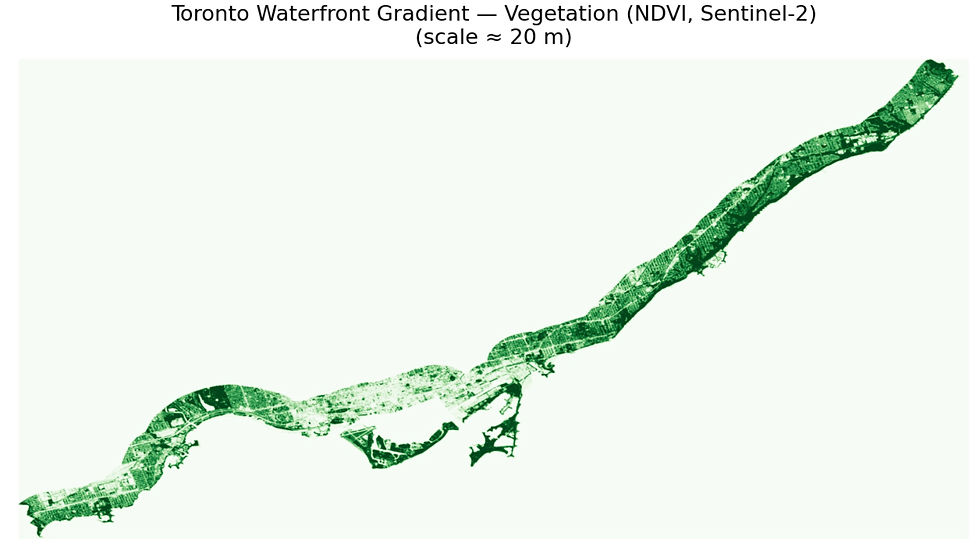
Figure 2: Waterfront Gradient in Toronto


Comments