Earthquakes in San Francisco
- Zarrin Tasneem
- May 12, 2023
- 2 min read

Earthquakes are a recurrent incident in the San Francisco Bay Area in Northern California. The region's position is along the San Andreas Fault, a crucial tectonic plate boundary that runs through California and is accountable for many earthquakes. The prospect of powerful earthquakes is always prevalent in the area, and scientists have made countless attempts to recognize and prepare for seismic activity. In current years, advances in technology and data analysis have permitted scientists to acknowledge better the patterns and attributes of earthquakes in the San Francisco Bay Area. The technology has enhanced earthquake monitoring and prediction systems and seeks to prepare better and mitigate earthquakes' influences on the region's infrastructure and population.

Figure 1: The map displays all San Francisco Bay Area earthquake data.
The map in Figure 1 shows all earthquakes that occurred in the past week and is filtered only to include earthquakes in the San Francisco Bay Area.
An earthquake data analysis is performed in a specific range using K-Means clustering and visualizes the results on a map in Figure 2.
I performed cluster analysis on the data by selecting the longitude and latitude columns, creating an array, and utilizing K-Means clustering, where I set the number of clusters to 5.
Creating the labels from the clustering analysis allocated to individual data points was crucial, and I performed KMeans clustering on the data with the number of clusters set to 5. I have assigned the labels generated from the clustering analysis to each data point. The image below shows a visual representation of earthquake data in a specific region, letting users visualize the location and magnitude of individual earthquakes and the clustering patterns in the data.

Figure 2: A K-Means Clustering Map of Earthquake Data

Figure 3: A Map, which shows the depth and magnitude of the Earthquake
The data analyzes the earthquake activity in the San Francisco area and identifies the frequent magnitudes of earthquakes. The bar chart shows a transparent visual representation of the data and is used to determine patterns or trends in earthquake activity.

Figure 4: A map of the San Francisco Bay Area with earthquakes of various magnitudes
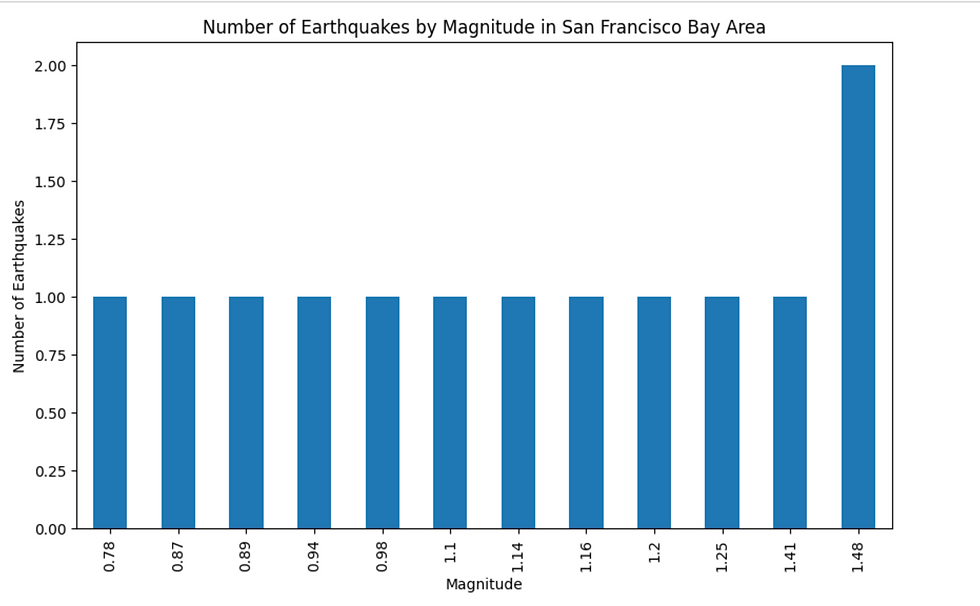
Figure 5: Graph of the magnitude based on the number of earthquakes

Figure 6: A histogram of the earthquake depths in the region.

Figure 7: Temporal distribution of earthquakes In conclusion, we can make decisions based on the online API dataset used to create maps and other visualization to take proactive measures when another earthquake hits.


Comments